遵从代码最佳实践或者代码规范指导,可以避免一些参见的坑,但在运行代码时遇到各种问题后,还是需要深入代码了解代码性能和瓶颈, 以便能够发现问题、解决问题和做出相应的优化。
1、profiler
性能分析器(Profiler)是一种动态的性能分析工具,可以提供程序在运行过程中的各种维度的关键性能分析,可以用来解决各种性能问题,定位内存泄露, 线程竞争死锁等问题。
Go运行时以pprof可视化工具预期的格式提供性能分析数据,分析数据可以在测试期间通过go test,或者从net/http/pprof包提供的endpoint收集。我们需要收集性能分析数据,并通过pprof工具对程序进行分析,并支持可视化数据。
Go 通过runtime/pprof包提对profile提供了内置的支持:
CPU: CPU分析采集一定周期内程序对CPU的使用情况,确定程序在主动消耗CPU周期是如何消耗时间的Heap: Heap分析,记录内存分配,用于监视当前和历史内存使用情况,以及检查内存泄露Goroutine: Goroutine分析报告所有当前正在运行goroutine的堆栈跟踪信息threadcreate: 报告程序中导致创建新OS线程的堆栈跟踪信息Block: 阻塞分析,显示goroutine阻塞等待同步(包括定时器通道)的位置,默认没有启用,可以使用runtime.SetBlockProfileRate启用它Mutex: 互斥锁分析,报告互斥锁的竞争情况,当认为互斥锁争用导致CPU没有得到充分使用时,可以使用这种分析,默认没有启动,可以使用runtime.SetMutexProfileFraction启用它
2、采集分析数据
目前有三种方式进行数据采集:
go test: 通过运行测试用例继续采集runtime/pprof: 直接在代码中指定采集程序运行数据net/http/pprof: 采集http server运行时数据进行分析
2.1、go test进行采样
测试标准库在go test中内置了对采集性能分析数据的内置支持,如下面的命令,在当前目录中运行测试,并将CPU和内存采样数据分别写入cpu.prof和
mem.prof:
|
|
2.2、通过HTTP加载实时采样数据
在长时间运行的http服务中,只需要导入net/http/pprof包,服务便可以进行采集数据,并多出一个终结点(endpoint)/debug/pprof,可用于观察采集到的
性能分析数据。包导入语句如:
1
|
_ "net/http/pprof" |
net/http/pprof 包初始化时在DefaultServeMux中为给定的URL注册了处理程序
|
|
这些handler将采样数据写入到http.ResponseWriter,导入net/http/pprof后需要做的,只是启动一个HTTP server就可以了,如:
1
|
http.ListenAndServe(":8080", nil) |
完整的最小采集demo:
|
|
运行程序后,就可以在浏览器访问localhost:8080/debug/pprof实时采样数据总览页面:

allocs: 所有已分配内存的采样block: 导致阻塞同步的堆栈跟踪cmdline: 显示程序启动的路径命令和参数goroutine: 所有当前goroutine的堆栈跟踪heap: 当前活动对象的内存采样mutext: 互斥锁持有者的堆栈跟踪profile: 进行CPU采样,采样完成得到一个供分析用的profile文件,默认采集间隔是30秒threadcreate: 创建新OS线程的堆栈跟踪trace: 程序的执行跟踪信息
直接通过上面的方式查看采样数据枯燥且缺乏直观性,后面介绍可以借助go tool pprof命令,可以更直观方便的分析采样数据。
2.3、在代码中指定采样
通过使用runtime/pprof包,可以直接在代码中进行采样,如可以使用pprof.StartCPUProfile(io.Writer)开始CPU采样, 使用pprof.StopCPUProfile()
停止CPU采样,如:
|
|
运行程序:
|
|
将CPU和内存采样数据分别写入文件cpu.prof 和 mem.prof。
3、使用采样数据
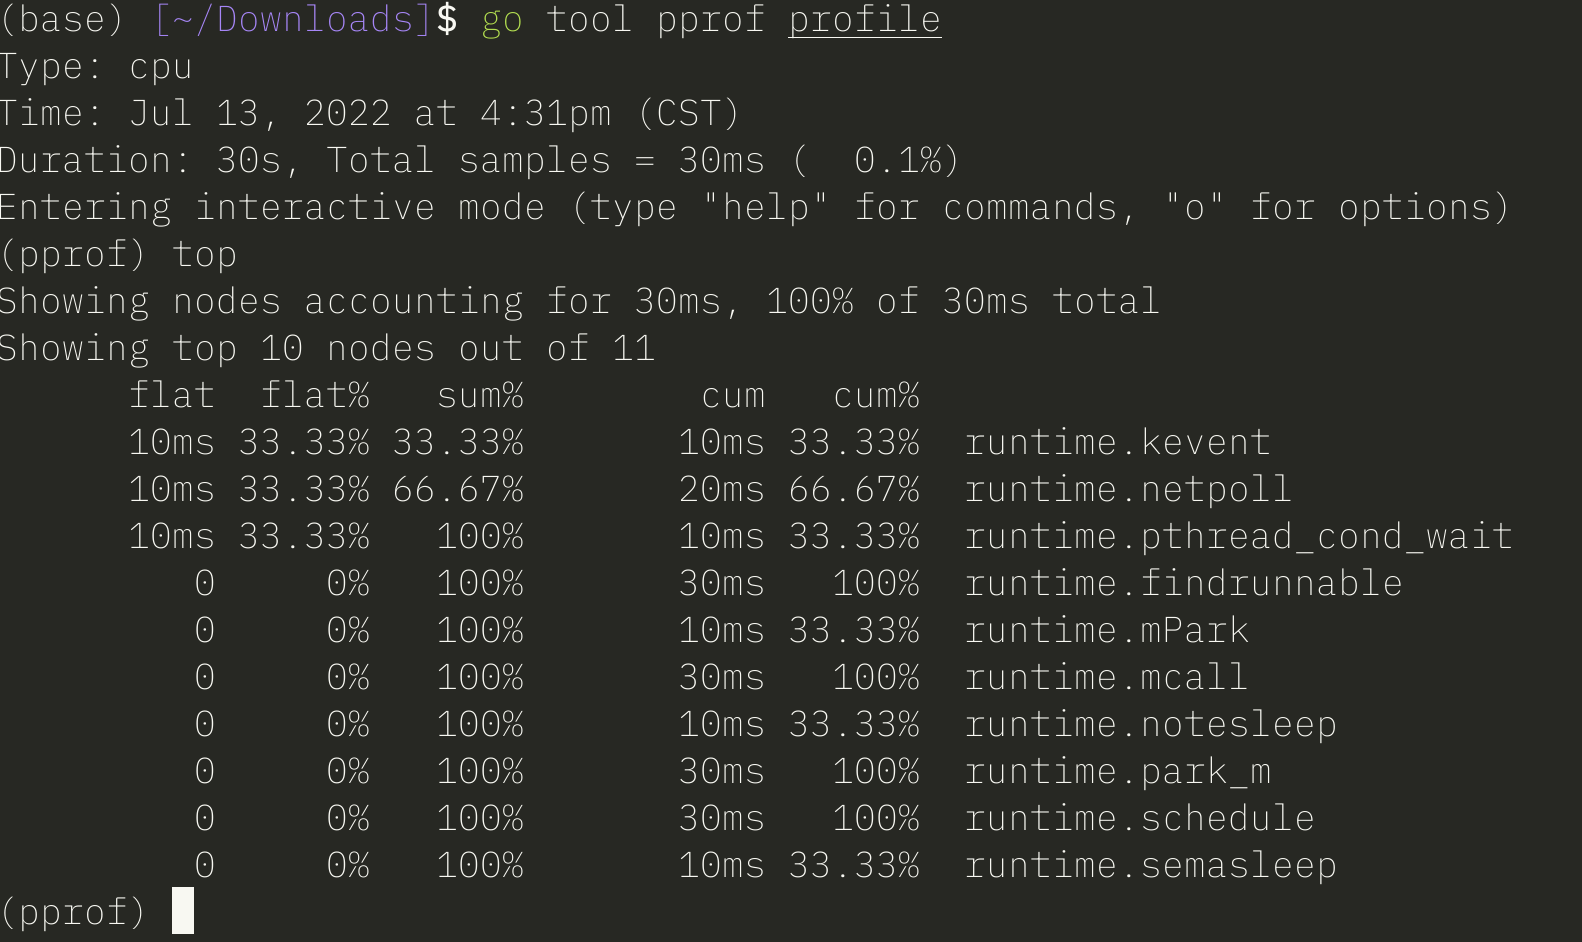
3.1、通过交互命令行终端
通过go tool pprof命令在交互命令行终端中使用采用数据,对于采样数据文件profile可以使用:
|
|
对于通过「采样方式2.2」HTTP 终结点方式,可以使用go tool pprof url的方式,如:
|
|

采样url,在可以在采样总览页面中获取到:

3.2、pprof可视化界面
使用pprof可视化界面时,在go tool pprof命令通过指定端口参数-http,运行一个pprof分析用的站点,如:
查看当前所有goroutine的堆栈跟踪
1go tool pprof -http :9090 'http://localhost:8080/debug/pprof/goroutine'

通过pprof提供的可视化界面,可以更清晰直观的查看调用链等信息。
Top

Graph

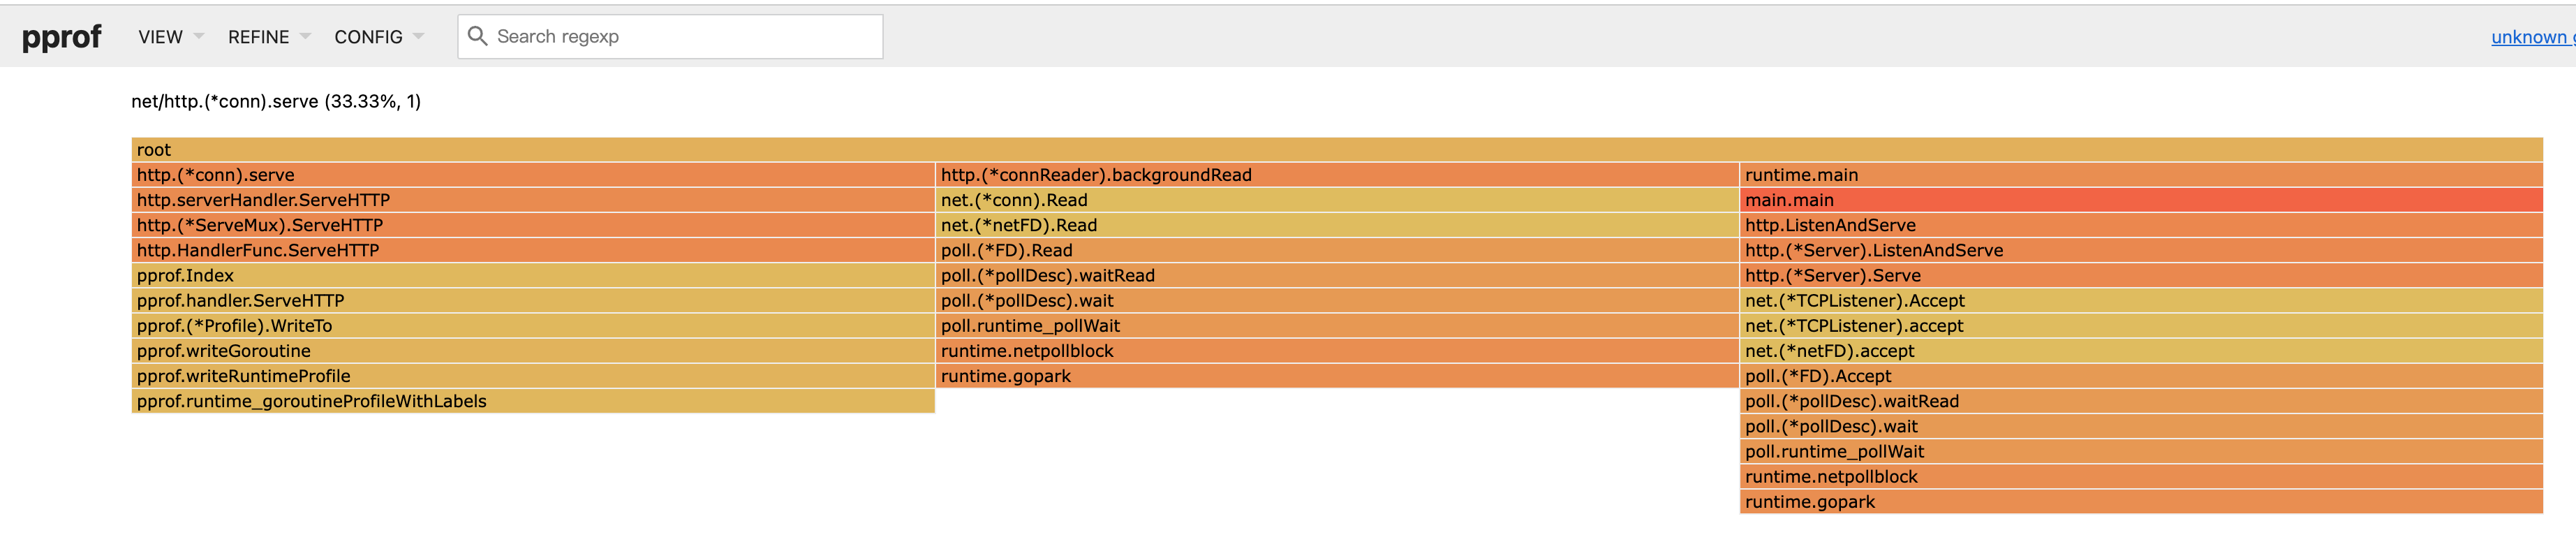
Flame Graph
Peek

Source

Disassemble
